Your tech company’s financial model, as an Executive and Board-ready dashboard.
FP&A Operating System translates detailed three-statement Excel models, built for SaaS, AI, or Semiconductor companies, with Board and Executive ready dashboards that update in real time as new information is provided. No more sending Excel files and PowerPoint presentations to your Executive team. Just insightful self-serve dashboards. Subscribe, download the model that fits your business, fill in your numbers, and see revenue, retention, burn, runway and unit economics in seconds. Your file is read in your browser and never saved on our servers.
Already paid? Finish creating your account
Built by a finance executive with over 25 years in Technology FP&A and investment banking.
See it in action.
Illustrative sample data for each vertical. Sign up to upload your own model and switch between views.
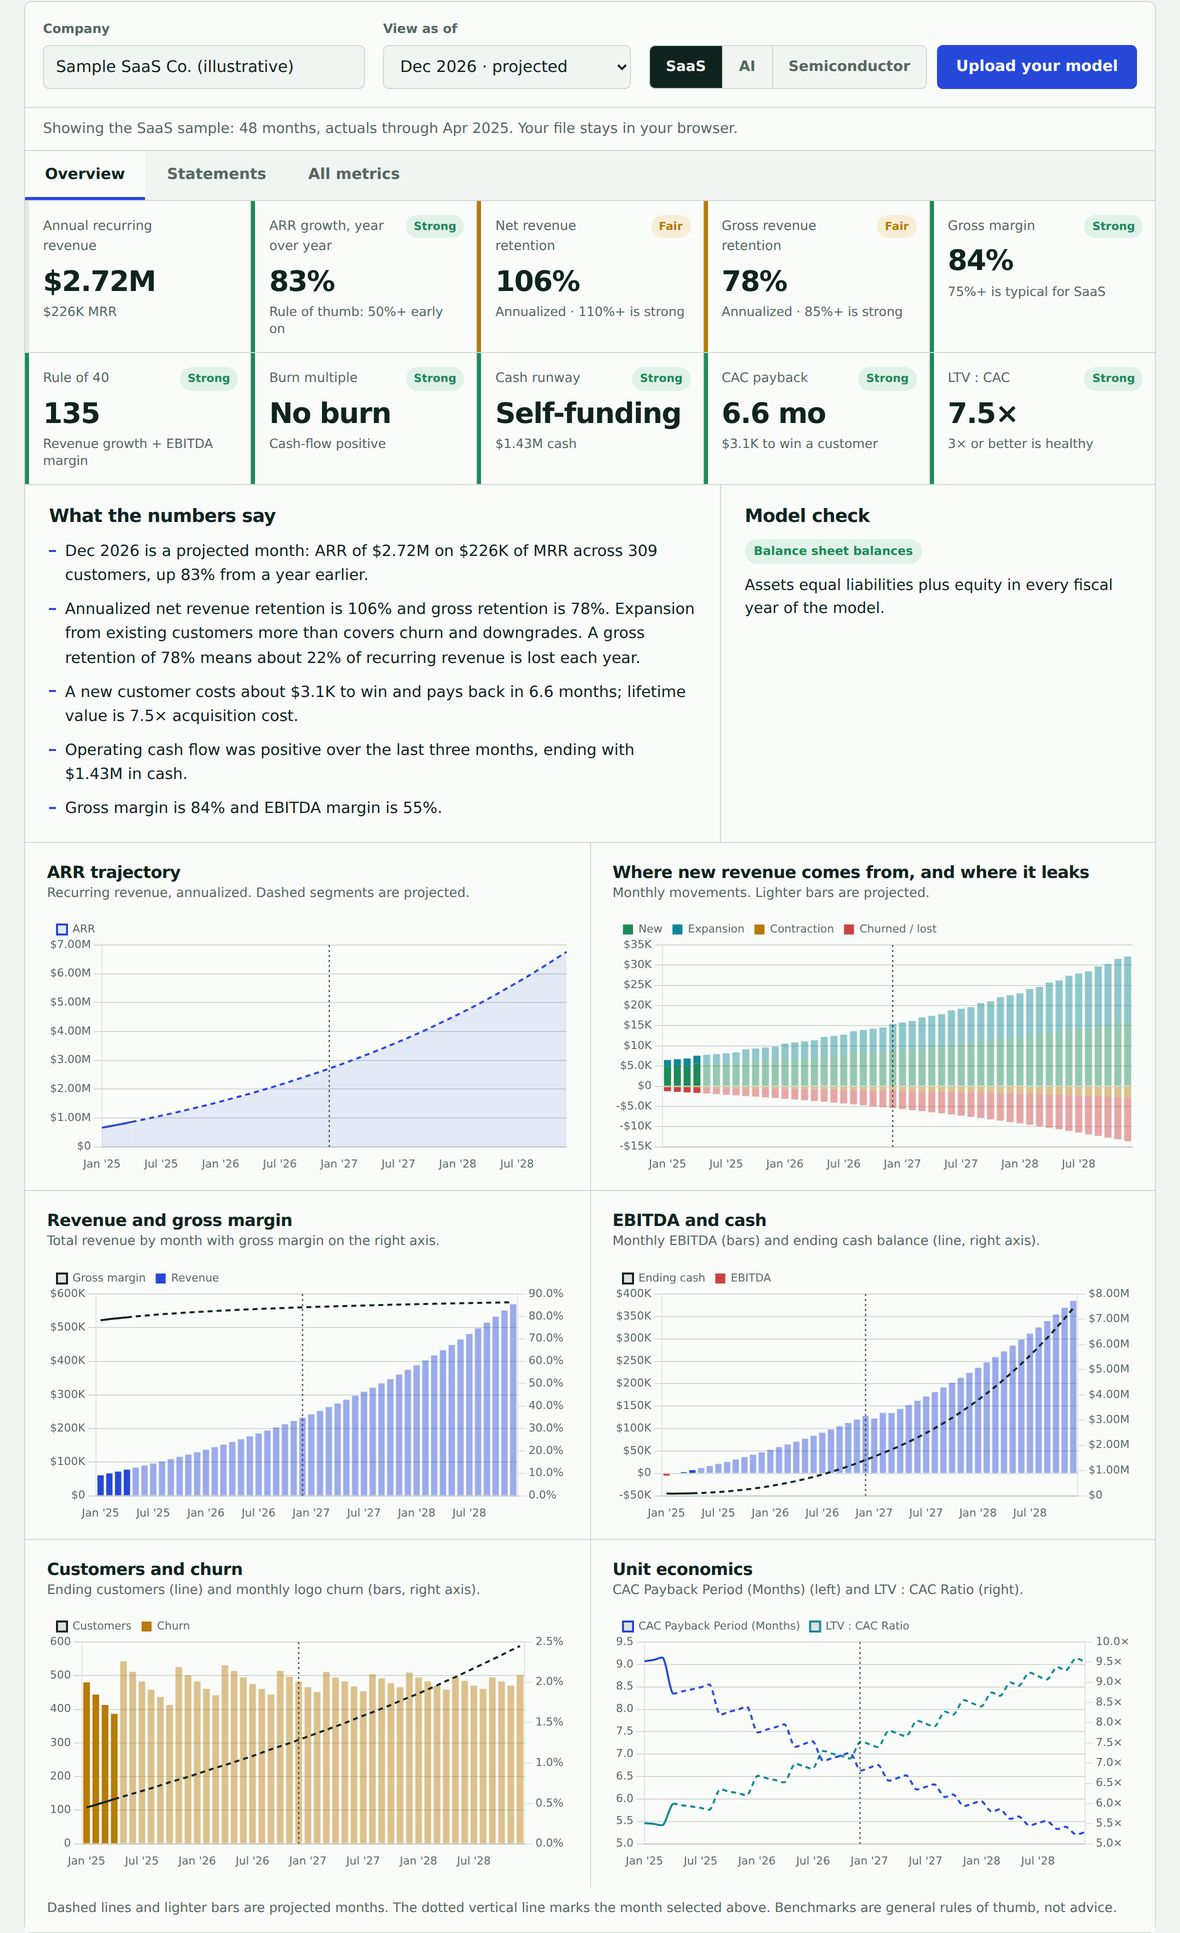
Sample screenshots shown. Sign up to upload your own model and get the live, interactive dashboard.
From Excel model to dashboard in three steps.
The model does the finance. The dashboard does the reading.
Pick your model
Three linked three-statement Excel models, one each for SaaS, AI, and semiconductor companies: assumptions, revenue schedules, income statement, balance sheet, cash flow and more than 50 KPIs built for that business model.
Enter your numbers
Fill in your assumptions and headcount, set the month you have rolled actuals through, and save the workbook in Excel.
Drop it here
Get an overview with benchmarks, annual statements, every metric by month, and a check that your balance sheet actually balances.
Simple pricing while we are in pilot.
Model plus dashboard, billed monthly. Cancel any time.
Starter
For founders and finance leads running one company.
- All three Excel models: SaaS, AI, semiconductor
- Unlimited dashboard uploads
- Overview, statements and all-metrics views
- CSV export of every metric
Growth
For fractional CFOs and small portfolios.
- Everything in Starter
- Upload PowerPoint presentations as a dashboard tab
- Priority email support
- Early access to new features as they ship
Advisor
For teams that want a second pair of eyes.
- Everything in Growth
- Monthly 30-minute model review with the founder
- Help tailoring the model to your business
Proposed pilot pricing. Final prices may change before launch.
Questions, answered.
Is my file uploaded to a server?
No. The dashboard reads your Excel file inside your browser. Nothing is sent anywhere, and closing the tab clears it.
What if my spreadsheet looks different from your model?
Today the dashboard reads the SaaS, AI Usage or Semiconductor dashboard tab of the matching FPAOS model, plus its P&L, BS and CF tabs. Mapping your own layout is planned.
How are the headline metrics calculated?
Retention, burn multiple and Rule of 40 are recalculated with standard definitions from your model’s own MRR waterfall, cash flow and P&L. The All metrics tab shows exactly what your workbook reports, so you can compare the two.
Do I need to know how to code?
No. You work in Excel like you always have, then drag the saved file onto the page.
Is this financial advice?
No. FPAOS is an analytics tool. Benchmarks are rules of thumb and nothing here is investment, tax or accounting advice.
Do I need an account?
Yes. After you subscribe, you create a password-protected account using the license key from your confirmation email. That account is where you upload your model and view your dashboards — nothing is accessible without logging in.